
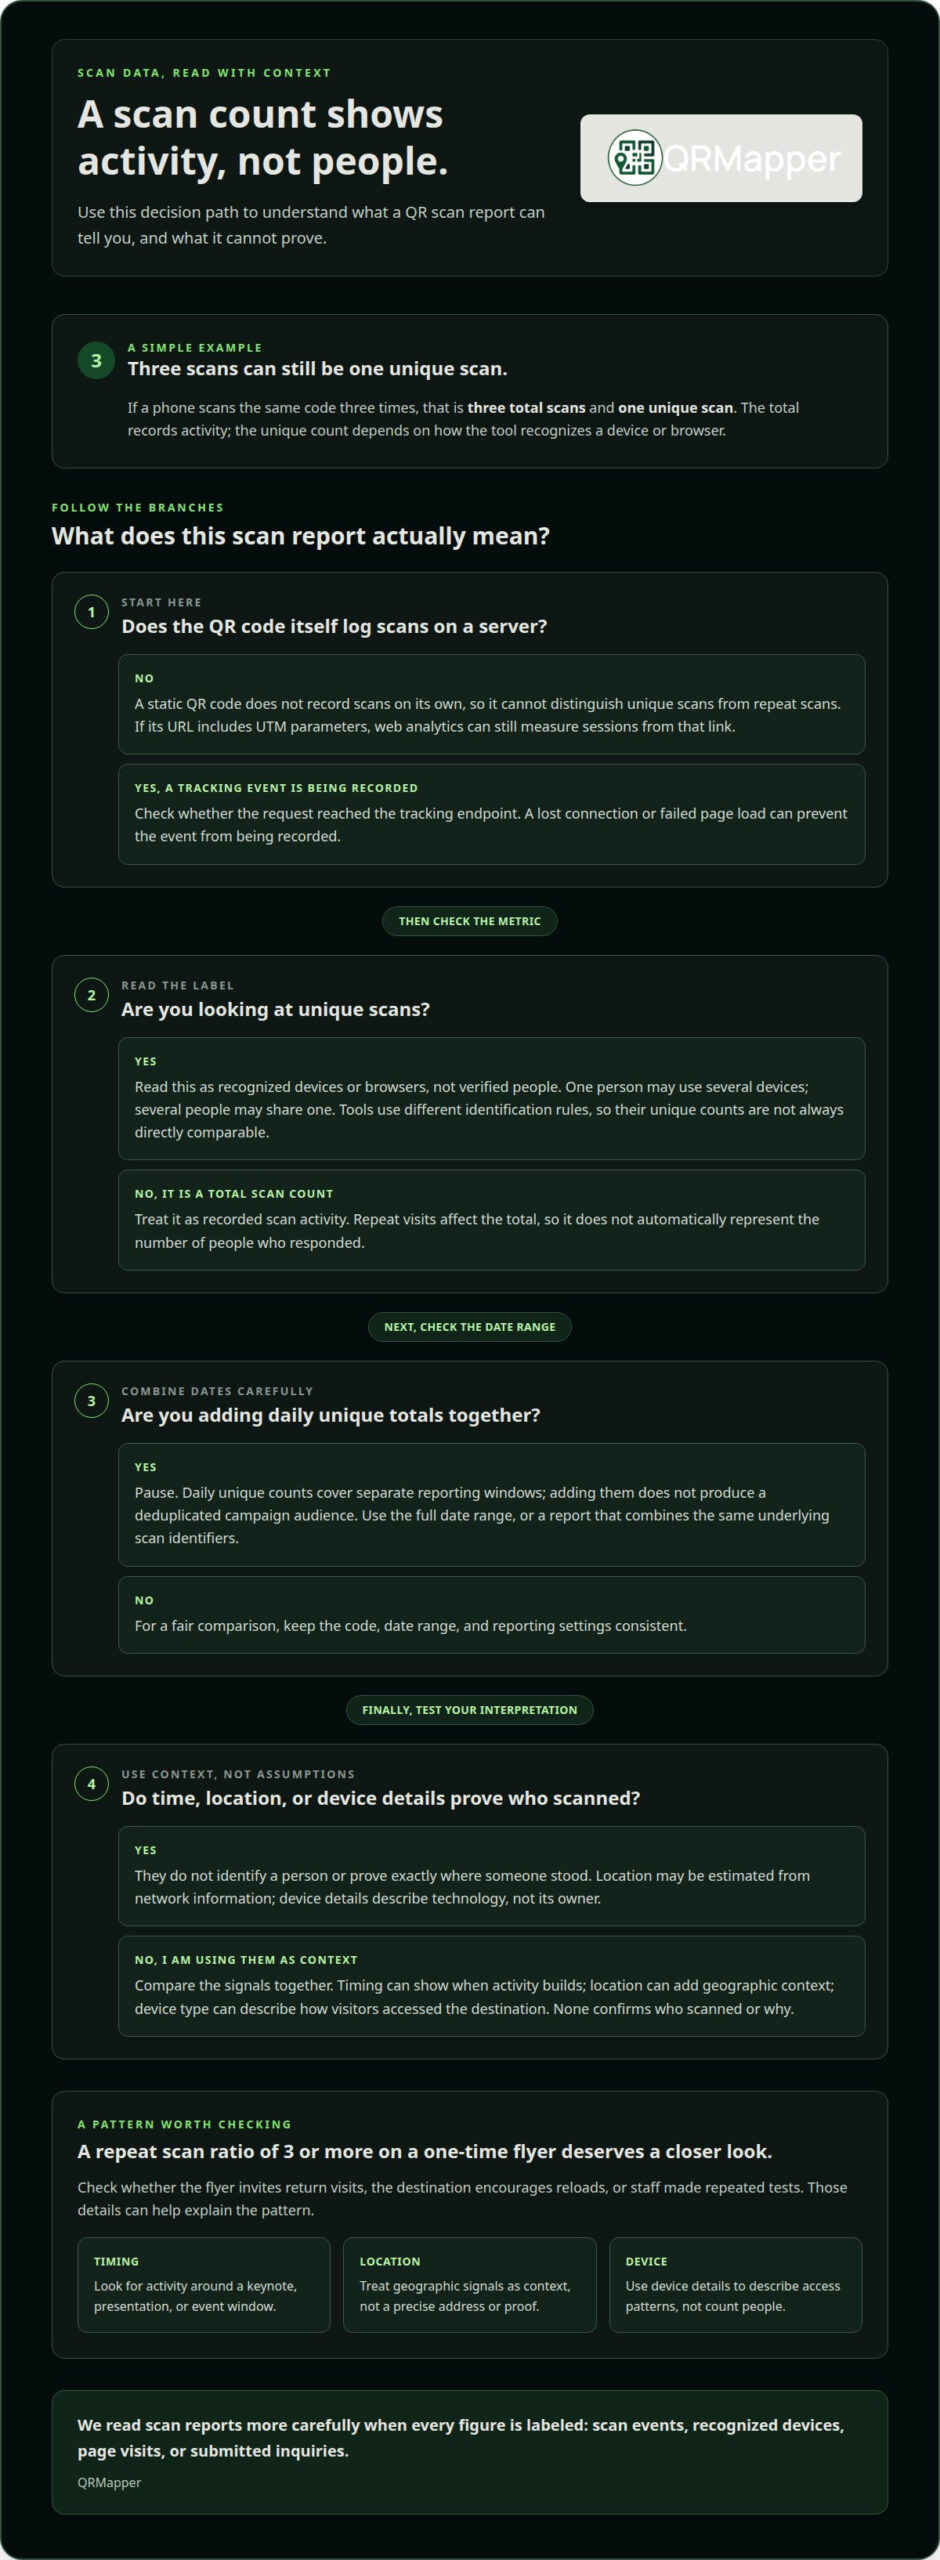
Understanding unique vs repeat QR scans helps separate recorded activity from estimated audience. A static QR code can’t distinguish unique from repeat QR scans on its own because it doesn’t log scans on a server. If a phone scans the same code three times, that creates three total scans and one unique scan. However, the code’s URL can still send sessions to web analytics when it includes UTM parameters.
It’s reasonable to expect scan totals to show how many people responded. They show activity, but repeat visits and different counting rules affect what the total means. Unique counts also depend on how a tool identifies devices, so figures from different tools aren’t always directly comparable.
We’ll explain how tools distinguish unique scans from repeat scans, what static codes can measure, and why daily unique counts don’t simply add up across dates. You’ll also see how timestamps, locations, and separate codes for a yard sign, table tent, or event banner can help you interpret patterns carefully. The goal is to understand what your printed materials are doing, not just report a bigger number.
Key Takeaways
- Unique counts depend on how a tool recognizes devices, so compare results only when you understand the counting method.
- Use timestamps, locations, and device details to distinguish a meaningful response pattern from a simple scan spike.
- Report unique scans across a full date range rather than adding daily unique totals together.
- Static QR codes don’t log scans themselves, but UTM parameters can help web analytics measure visits from the encoded link.
- Give each print channel its own tracked code when you need to see which materials are drawing attention.
How Do Timestamps, Locations, and Device Types Reveal Meaningful Patterns?
A scan timestamp, location, and device type add context to a count, but they don’t identify a person on their own. The time window matters: depending on its rules, a tool may count the same device as unique again in a later reporting period. Compare scans using the same date range and counting method.
Start with timing. An event banner scanned steadily before a keynote suggests a different response pattern from a sudden cluster after the speaker’s call to action. Hourly or daily views show when activity builds, while the full campaign range gives the broader picture. Check the reporting time zone, too. A scan near midnight may fall on different calendar dates in different zones.
Location adds another dimension. If scans from a garage entry sign cluster near the venue, it may be reaching drivers on site. Scans from distant areas could reflect sharing or a broader campaign audience. Analytics may estimate location from network information, such as an internet protocol address. Treat this as geographic context, not a precise address or proof of where someone stood.
Device type helps distinguish access patterns. For example, a hotel brochure scanned from an iPhone or Android phone indicates a mobile visit, while a tablet may suggest a different browsing context. Device details describe the technology used, not whether each device belongs to a different person. One person can use several devices, and several people can share one.
Tools identify devices in different ways. Some rely on browser storage, such as cookies; others may combine browser, device, or network signals. A cleared cookie, new browser, or changed device can make one person appear new. Shared devices and privacy settings can also affect whether repeat activity is recognized. So unique counts from different QR tools aren’t directly comparable: their identification rules differ.
Read the signals together rather than treating one field as proof. If scans from an event banner rise at a specific time, location and device details can help describe where the activity came from and what devices opened the destination. They still can’t confirm who scanned or why. For the same QR code and date range, unique scans can’t exceed total scans.
For a practical comparison, use the same code, date range, and reporting settings in every view you review. Then look for a meaningful pattern: a cluster after a presentation, recurring activity near a venue, or different device mixes between a table tent and a trade show handout. These details help explain scan behavior without turning device counts into a headcount.
How Are Scan Events Actually Recorded and Validated?
A scan report is useful only when its event definitions match the decisions you need to make. Keep recorded activity, device-based estimates, and completed customer actions separate.
For U.S. campaign reporting, treat scan signals as activity data, not as a person’s identity. Limit analysis to the fields your campaign needs, and explain the tracking in your privacy notice.
A phone can decode a QR pattern without a successful visit appearing in online analytics. Server-side measurement requires a request to reach the tracking endpoint. A lost connection or failed page load can prevent that event from being recorded.
Accuracy of Unique Scan Counts
A unique count estimates recognized devices or browsers, not verified people. One person may use separate work and personal phones, while several people may share a tablet. For a property brochure, the count can therefore differ from the number of prospective buyers. Use it to compare activity under consistent reporting settings, not as a headcount for sales forecasts.
Repeat Scan Ratios
A repeat scan ratio compares recorded scan events with recognized devices, expressing average activity per device. A ratio of 3 or more on a flyer intended for one-time use is worth investigating. Check whether the flyer invites users to return, whether the destination encourages reloads, and whether repeated tests came from staff. Those checks help distinguish expected use from an unusual pattern.
A useful dashboard shows total events, unique devices, date range, and code identity together. It should also distinguish a scan request from a completed page visit. For an event banner, this lets a manager see whether activity occurred during the event window without mistaking visits for registrations. Keep field names consistent so reports can be compared across campaigns.
Validate the report by checking that recorded events match the customer journey. Scan a test code, confirm the destination loads, and compare the event record with the site’s analytics. Then submit a test form and verify that the resulting lead has the correct campaign source. A scan count alone doesn’t validate a form submission or sales outcome.
Sales routing should preserve useful context without turning every scan into a lead. Route submitted inquiries with their campaign source, city, and time window when those fields are available. For example, grouping submitted inquiries by campaign and time window can help a team assign follow-up responsibilities. Verify response times in your own records rather than inferring them from scan counts.
Before sharing a campaign report, label each figure as scan events, recognized devices, page visits, or submitted inquiries. That distinction gives marketing and sales teams a shared basis for interpreting results.
Combining unique counts across dates or codes
Daily unique counts describe separate reporting windows, not a campaign’s deduplicated audience. To get a combined figure, use the full date range or a report that can combine the same underlying scan identifiers.
Consider a QR code scanned by 100 unique devices on Monday and 100 on Tuesday. The combined two-day unique count is between 100 and 200, not necessarily 200. If the same devices scanned on both days, the combined count stays closer to 100. If the groups did not overlap, it reaches 200. Daily totals alone don’t reveal that overlap.
Adding daily unique counts can overstate the audience across a longer campaign. Report the full range instead of summing each day’s unique figure. For example, use Monday through Tuesday as a single reporting period when presenting the combined audience. Keep the daily view separate when you need to see which day drew activity.
Codes create a similar distinction. A newspaper ad, magazine placement, and billboard can each have a separate QR code leading to the same page. Adding their unique counts gives total code-level unique activity, but not necessarily the number of distinct people across all three channels. Someone may scan the billboard and later scan the newspaper ad.
Use these reporting views for different decisions:
- Use one code’s full date range to report its unique devices across the campaign.
- Use each channel’s code separately to compare the newspaper, magazine, and billboard.
- Use a combined, deduplicated report only when the same identification method applies across the codes and date range.
For example, a manager comparing a trade show handout with an event banner may need two answers. Separate code totals show which printed placement generated more scan activity. A deduplicated combined count estimates the shared audience across both placements, provided the tracking system can match devices across codes.
Make the reporting question clear in the label. “Unique devices by code” and “unique devices across the campaign” describe different measures. A Monday report and a full-week report also answer different questions, even when they cover the same QR code.
When a report combines codes, record the date range, included code names, and whether the count is summed or deduplicated. This brief note helps sales and marketing teams compare results consistently, rather than treating channel totals as separate people.
At the scan level, repeat activity and audience reach are distinct: if the same phone scans a QR code three times, that’s three total scans and one unique scan. Don’t add daily unique scan counts to calculate a multi-day unique count. Report the full date range when the platform supports deduplication over that range. QRMapper uses daily anonymous hashes, so do not assume those identifiers can deduplicate visitors across different days.
Connect scan reporting to verified outcomes from your own campaign. Keep engagement claims, inquiry counts, and response times separate, and include the reporting period and counting method.
Measuring static QR codes
A static QR code doesn’t log scans on a server. It encodes a destination directly, so a restaurant table tent may send every phone to the same menu URL. To measure visits, add UTM parameters to the URL and review the resulting sessions in web analytics. The code remains static, while the analytics platform records activity after a visitor reaches the site.
For example, a URL can identify a campaign as “table_tent” and a source as “dining_room.” When someone scans the code and loads the tagged menu page, web analytics can attribute the session to those values. Use distinct UTM values for a brochure, yard sign, or event banner, even if every code leads to the same page. This separates channel reporting without changing the destination content.
This measurement has limits. A server-side scan count and a web analytics session count measure different things. A scan that fails to load the page may not create a session. A later visit may count as another session, depending on the analytics platform’s rules. Session counts also don’t automatically show how many people scanned, since one person can return or use another device.
Set up measurement before printing. Keep campaign names consistent, use readable values, and test the tagged destination on a phone. A mismatch, such as “event_banner” on one code and “event-banner” on another, can split the reporting. Confirm that the page loads and the analytics report receives the campaign source. This tests the path from printed code to measured visit.
Use a fixed test period to make comparisons easier. Run the QR code test for one week, then compare tagged sessions with the campaign dates and placement. For a hotel brochure, note whether the code appeared at reception or in guest rooms. This context helps distinguish a change in placement from a change in visitor behavior.
- Use one distinct set of UTM values for each printed channel.
- Keep the destination and reporting period consistent during comparisons.
- Review tagged sessions separately from unique-device or scan-event counts.
Static measurement works best when the destination stays available and the tagged URL remains unchanged. If the menu page moves, the printed code still points to its original address. The code itself can’t redirect visitors to a new destination, so the old URL must keep working or forward visitors through the website’s own configuration.
Use web analytics to understand visits after a scan, and label each printed placement clearly. This gives you a grounded view of which materials brought people to the page without treating every session as a distinct person.
Unique versus repeat scan identification
Compare the three measures together: total scans count recorded scan events, unique scans count recognized devices, and repeat scans are events beyond the first recognized scan. A report showing 500 total scans from 120 recognized devices records activity from those devices; it does not verify 120 individual people.
Each figure has a specific purpose. Total scans show activity volume. Unique scans estimate how many devices engaged. Repeat activity may signal return visits, shared material, or a practical reason to scan again, such as reopening a parking payment page. None of these measures alone proves how many individual customers saw the printed code.
Identification usually depends on a browser or device signal that lets analytics recognize a later scan. A phone that returns with the same recognizable signal may count as one unique device and multiple total events. Someone who scans first on a work phone and later on a personal phone may appear as two unique devices. Shared tablets can produce the opposite pattern.
For a campaign report, read the figures in this order:
- Set the same code and date range for each measure.
- Read total scans as recorded activity, not people reached.
- Read unique scans as the tool’s device-based estimate.
- Compare total and unique scans to understand repeat activity, then consider the code’s purpose.
For instance, a restaurant table tent may prompt repeat menu visits, while a one-time event check-in code serves a different purpose. A higher repeat share could suit the first use and deserve a closer look in the second. There’s no universal “good” ratio. Context matters.
Keep the calculation consistent. If the report defines repeat events as total scans minus unique scans, label the value clearly. If it displays scans per device instead, label that as an average. Don’t present either measure as a count of confirmed returning customers. Identification rules can vary between tools, so compare campaign periods using the same platform and settings.
A useful summary might read: “The trade show handout recorded 500 scan events and 120 recognized devices during the reporting period. Repeat activity reflects additional events from devices the system recognized.” That wording preserves the distinction between measured events and estimated audience, helping sales and marketing teams make a sound comparison.
Use a consistent reporting method for every printed campaign. Set up QR scan tracking to compare scan activity with the purpose of each code.
QRMapper: QR Code Management
QR Code Management helps teams manage printed materials alongside ongoing campaigns. Scan analytics can give a manager another way to assess how a yard sign, event banner, or brochure performs.
This approach works when a printed code needs to stay useful as campaigns change. QR Code Management supports the connection between the code and its destination, while Digital Marketing can link scan activity to broader campaign planning.
For event teams, separate codes for signs, handouts, and banners can help compare scan activity by placement. These are QR campaign workflows, not a claim that QRMapper provides an event management service.
Make the Next Print Decision With Clear Intent
Use the distinction between unique and repeat QR scans as one part of the decision, not as a verdict on campaign success. Pair scan reporting with the outcome that matters to your team, such as a completed inquiry or event registration. This gives your next campaign a clearer direction.
QRMapper offers QR Code Management, analytics, and Digital Marketing to help teams connect printed campaigns with measurable activity. If you want to plan QR scan tracking around your materials and goals, contact QRMapper about QR scan tracking.
A considered measurement plan gives every print decision a firmer footing.
Frequently Asked Questions
What is the difference between unique and repeat QR scans?
The distinction helps separate breadth of engagement from continued activity. For example, repeat scans of a product package’s setup instructions may reflect useful reference behavior, not a weak campaign. Decide what the printed material is meant to prompt before judging either measure. This gives your team a more relevant basis for comparing responses over time.
What should I compare in a QR campaign report?
Compare campaigns using the same dates, code purpose, and outcome definition. The unique vs repeat QR scans distinction can help explain activity, while a completed registration or inquiry shows whether visitors took the next step. Keep these measures in separate columns rather than combining them into one success figure. A manager can then see whether a change affected attention, follow-through, or both.
What should I do if scans rise but inquiries stay flat?
Check the path from the printed piece to the inquiry form, then test it on a phone. Confirm that the page matches the promise on the material, the form submits correctly, and the confirmation appears afterward. For a direct-mail offer, compare the wording on the mailer with the landing-page headline. This review can reveal friction beyond the scan count.
How can I make QR reporting easier to act on?
Start each campaign with a decision in mind, such as choosing which brochure version to reprint or which event placement to continue. Name codes and reports to match those decisions, so teammates can recognize each placement without decoding internal labels. If you’re setting up a managed QR workflow for upcoming print materials, Create a permanent QR home.
Compare reports with our QR code analytics guide, or explore QRMapper with a 14-day free trial.