
A practical QR analytics retention period for most marketing campaigns is 30 to 90 days, which covers the active campaign phase. The right choice depends on how often you report, how long you need to understand audience behavior, and which records your platform keeps. Keeping data longer isn’t automatically more useful; the aim is to retain what supports a clear decision.
If you’re tracking scans from a yard sign, table tent, or event banner, QR analytics retention needs to cover the campaign’s real reporting cycle. A period that’s too short can leave gaps in your analysis; one that’s too long may keep records you no longer need.
Set a retention period that matches your reporting schedule, the insights you need, and the types of QR data you collect. The right platform can help you manage records over time, so your decision is deliberate rather than automatic.
Key Takeaways
- Set a retention period that gives each campaign time to complete its reporting cycle, rather than choosing one by habit.
- Use scan patterns to understand audience behavior, while keeping clear which insights your analytics can actually support.
- Separate summarized results from individual scan records; they serve different reporting needs and may call for different retention periods.
- Review what data your QR platform records, including whether device-related details are included, before deciding what to retain.
- Choose analytics tools that make scan activity useful across printed channels and help you manage codes after they are deployed.
How long can I keep QR code analytics? Choosing a QR analytics retention period
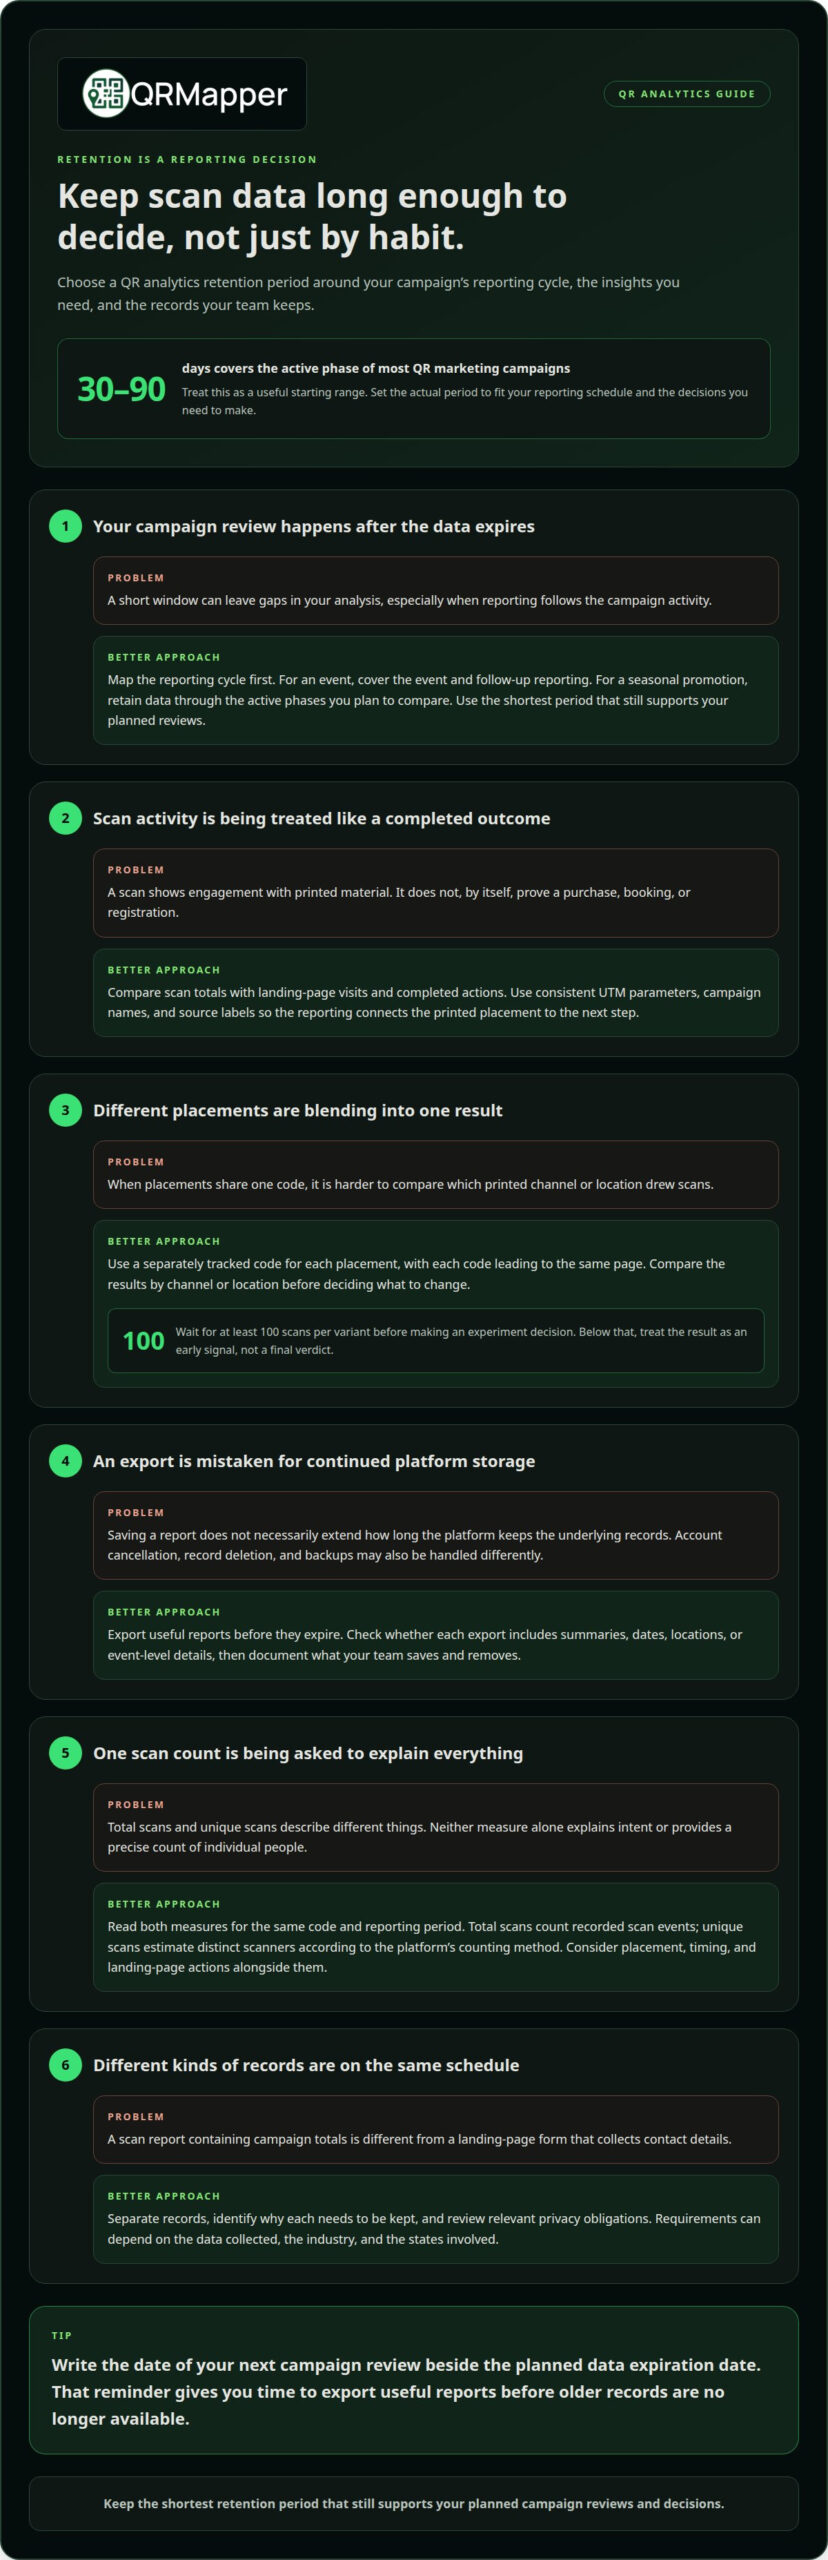
For most QR code marketing campaigns, retaining analytics data for 30 to 90 days covers the active campaign phase. Choose a period that also fits your reporting schedule, the insights you need, and the types of records your team keeps.
Tip: Write the date of your next campaign review beside the planned data expiration date. That reminder gives you time to export useful reports before older records are no longer available.
-
Examine scan activity over time
Review scan activity across reporting periods, then connect changes to specific decisions. For example, compare scans from a direct-mail campaign with the date its offer ends. Use a consistent time zone so reports don’t place scans in different periods. Let the pattern guide your next review instead of keeping detailed records without a clear purpose.
-
Export data and review retention options
Export reports before they expire, and note whether each file includes summaries, dates, locations, or event-level details. Retention controls vary by platform: some let account owners adjust the period, while others use a fixed window. Review the export process and settings before relying on historical reports. Save only the fields needed for later decisions, and keep campaign labels attached so each export remains clear.
- Consider privacy obligations before setting a retention schedule. In the United States, applicable requirements can depend on the data collected, the industry, and the states involved. A campaign that collects contact details through a landing-page form, for example, involves different records from a scan report containing only campaign totals. Separate the records, identify why each needs to be kept, and apply your organization’s privacy review to the relevant data.
- Decide how your platform handles exports, customized retention, deletion, and account cancellation. Exporting a campaign summary can preserve it for later use, but it doesn’t necessarily extend the platform’s storage period. Account cancellation may also be different from deleting scan records or removing backups. Review the relevant account and data settings, then document what your team exports and removes. A useful QR analytics retention schedule covers both active platform data and saved copies.
Campaign reporting cycles and retention periods
Set retention around the decisions your campaign must support, not an arbitrary calendar setting. A launch report, placement test, and later conversion review may each need a different window.
- Map the campaign’s reporting cycle before selecting a retention period. For a short event, record scans through the event and its follow-up reporting; for a seasonal promotion, preserve data long enough to compare its active phases. A 30-to-90-day period covers the active phase of most QR code marketing campaigns. Use the shortest period that still supports your planned reviews and decisions.
- Separate placement tests from campaign-wide results. Give each printed location or variant its own QR code, while sending each code to the same landing page. A newspaper insertion, magazine placement, and billboard can then be compared without mixing their scan data. For an experiment, wait until each variant has enough scans to compare before making a decision. If a variant has fewer scans, treat its result as an early signal, not a final verdict.
- Connect scans to actions before assessing campaign return. A QR scan shows engagement with printed material, but it doesn’t prove a purchase, booking, or registration. Add consistent UTM parameters to the destination link, then compare scan totals with landing-page visits and completed actions in your analytics dashboard. Keep campaign names and source labels consistent so a trade show handout doesn’t appear under several unrelated names.
- Choose a review window that matches how quickly people are likely to act. A restaurant table tent may prompt an immediate menu visit, while a real estate yard sign may lead to a later inquiry. Review scan and conversion patterns together, and keep enough campaign data to see whether scans led to the intended next step. A high scan count alone doesn’t prove strong return if the landing page produces few relevant actions.
- Use location results to make a specific placement decision. Compare scans from separately tracked codes at different venues, neighborhoods, or event areas, then align the results with where each item appeared. If one location draws scans but few completed actions, examine the offer and landing page before moving the sign. For operating campaigns, a separately tracked QR code for each channel keeps attribution clearer as placements change.
Unique scans and audience behavior
Total scans measure activity; unique scans offer a separate view of reach. Consider both before deciding what the numbers reveal about your audience.
- Understand how the dashboard defines each scan measure. Total scans generally count recorded scan events, while unique scans estimate distinct scanners according to the platform’s counting method. One person scanning a menu twice may add two total scans while the unique count stays the same. This distinction helps separate repeat engagement from broader reach, but a unique-scan count isn’t a precise count of individual people.
- Compare total and unique scans for the same QR code and reporting period. If a product insert has many total scans but fewer unique scans, repeat visits may explain some of the activity. If both measures rise, the code may be reaching more distinct devices or visitors. Neither pattern explains intent on its own, so consider the landing-page action, placement, and campaign timing before changing the offer.
- Check how the platform identifies a unique scan before interpreting audience size. Some systems may rely on device or browser signals, which can change when someone switches devices, clears browser data, or scans again later. One person using a phone and tablet may appear as two scanners; a shared device may represent several people. Treat the count as an estimate, not a verified headcount.
- Use device and operating system summaries to guide practical decisions, not to infer personal traits. If a museum brochure directs scanners to a page that works poorly on a particular screen size, for example, device patterns can prompt a usability review. An operating system report describes technical context; it doesn’t reveal a scanner’s identity, preferences, or reason for scanning.
- Distinguish static from dynamic QR codes when assessing what scan data can tell you. What scan activity you can measure depends on how the code and analytics setup are configured. Dynamic QR codes can support scan reporting, depending on the platform. Review total and unique scans over the campaign period, then retain only the detail needed to compare reach, repeat activity, and resulting actions.
Aggregated metrics versus event-level records
Choose what to retain based on the decision each record supports. A campaign summary can show whether printed material worked; individual scan events can help explain when or where activity changed.
- Separate summary metrics from event-level records before setting a retention period. An aggregate might show the number of scans a yard sign received during a reporting window. Event-level data may record each scan’s time, destination, or available device type. Summaries support campaign comparisons; detailed events help investigate patterns. Keep the distinction clear: retaining detailed records after they stop informing a decision adds complexity without improving the summary.
- Keep the aggregate measures needed for your next review. A hotel, for example, might compare monthly scans from lobby signage with scans from a parking sign. Record the reporting period, QR code or placement label, total scans, and relevant outcomes. Those fields let a manager compare engagement without revisiting every event. If the campaign changes, save the earlier summary separately so results from the old destination aren’t mixed with the new one.
- Keep individual events only when they answer a defined operational question. If scans from an event banner suddenly stop, for example, timestamps can help pinpoint when the pattern changed. Device type may help reveal a technical issue, but it doesn’t identify a person or explain intent. Limit event details to fields that support troubleshooting, attribution, or a specific business decision. Don’t keep granular records simply because the dashboard displays them.
- Structure exports so future comparisons remain clear. Include a campaign label, placement, reporting dates, and destination version in each summary. If a table tent’s landing page changes midway through a promotion, distinguish scans from before and after the change. Without that context, a later report may combine different offers under one QR code and misrepresent engagement. A concise data dictionary can explain each exported field to the next reviewer.
- Set a review point for each record type, then remove details that no longer serve a purpose. A marketing lead might retain campaign totals for year-over-year planning while deleting event-level rows once troubleshooting ends. The right period depends on reporting and business needs, not the dashboard’s maximum storage setting. Before deletion, preserve the aggregate results needed for decisions and keep them connected to their campaign labels.
Do QR code analytics include personal information or device identifiers?
Some scan reports contain campaign totals; others include technical details that need more careful handling. Review the fields your platform records before setting a retention period.
- List the fields captured for each scan. A report might include a timestamp, approximate location, device type, IP address, or campaign identifier. These fields have different privacy implications. Review the dashboard and an exported sample, then note which details are necessary to evaluate a yard sign or event banner. Don’t assume all QR platforms collect the same fields or use the same settings.
- Distinguish campaign labels from information that could identify a person. A label such as “spring-brochure” identifies a marketing placement, not a customer. A name or email address in a URL parameter is different. Avoid including personal details in QR destinations, tracking labels, or scan IDs. If a landing-page form collects contact details, manage those submissions separately from scan analytics.
- Retain details only for a defined business purpose. Timestamps might help explain a sudden change in scans, while a campaign total may be enough for routine performance reporting. Keep the smallest useful set of fields, limit access to staff who need it, and record why the information remains. This gives your team a clear basis for reviewing older records.
- Set separate review points for summary reports and detailed records. A campaign total may support later planning even after individual scan events stop helping with troubleshooting or performance review. If records include device or network identifiers, consider whether those fields are still necessary after the campaign review. Tell the team what the schedule is and what happens when data reaches its deletion date.
- Understand deletion before closing an account or switching platforms. Review how the account terms address active scan records, exported files, and stored backups. Preserve reports needed for a documented business purpose in an approved location, then remove unnecessary copies. Recording these decisions helps your team handle future campaigns consistently.
The GDPR is identified as Regulation 2016/679 and establishes the storage-limitation principle for personal data, reinforcing the need to keep identifiable scan details only as long as they serve a defined purpose.
Treat that figure as context, not a reason to retain more personal or device-level data.
QRMapper: analytics
At QRMapper, we help teams connect scan activity to the printed campaigns they manage. Our analytics show scan activity by time and location, giving you a practical way to assess whether a yard sign, event banner, or other placement is reaching its audience.
With QRMapper’s QR Code Management, you can change a code’s destination without reprinting. The printed pattern stays the same while your team updates the link behind it.
QRMapper brings scan analytics and QR Code Management together, helping teams use printed campaigns to inform their next decision.
Make your retention policy part of campaign planning
Make data handling intentional before your next campaign goes to print. Decide what decisions the scan data should support, who will use it, and when detailed records will no longer be useful. Planning ahead keeps QR analytics retention tied to real reporting needs rather than an inherited platform setting.
For teams managing several printed channels, consistent measurement can clarify where attention comes from and what to change. QRMapper offers analytics and QR code management to support that work. Build your retention approach around your campaign, the records you collect, and the decisions your team needs to make.
Ask QRMapper about QR analytics and take a considered next step toward clearer campaign reporting.
Frequently Asked Questions
How do dynamic QR codes change data retention?
Dynamic QR codes separate the continued use of the printed pattern from the retention of scan analytics. You can change a destination after printing, while reports follow the platform’s data-retention settings. A restaurant, for example, can keep table cards in place while updating a seasonal menu link, then retain campaign reports according to its review needs. Decide separately how long the code should remain in use and how long its scan records are useful.
Why does a QR code data retention policy matter?
A written policy gives your team a consistent way to handle scan reports when campaign owners change or projects end. A marketing lead might specify who saves the final event report, which summary supports future planning, and when detailed exports should be removed. This prevents team members from keeping separate files indefinitely. A policy also clarifies why a report remains available and who can access it.
Can any QR Code be tracked?
No. A QR code that directly encodes a web address doesn’t automatically provide scan reporting. Tracking requires a measurable link or a platform that records activity when the code is scanned. A printed flyer with a direct link, for example, may show activity on the destination site without providing a separate scan count. Choose a trackable setup before printing if you need to compare individual materials.
How do you determine the right retention period?
Choose a period that covers the decisions your team expects to make, then separate summary reports from detailed scan records. A seasonal product team may need to compare results after a promotion ends, while a one-day event may call for a shorter review process. Include the campaign owner, reporting date, and intended decision in your plan. If those details change, reassess the period instead of extending it automatically.
What analytics do QR code platforms track?
Available fields depend on the platform. QRMapper reports scan activity over time, unique and repeat visitors, device type, browser, and country. Its analytics use anonymous daily hashes, and no personal visitor data is stored. A retailer, for example, can use browser and device summaries to spot a technical issue with a product page. These fields describe scan activity, not a named person’s identity or reason for scanning.
How long do QR code platforms retain scan analytics data?
Retention varies by platform and plan, so check the analytics history associated with your account. QRMapper provides a 7-day analytics window on Free, 30 days on Pro, 90 days on Business, and 365 days on Enterprise. If a report must support a later review, plan when to export or preserve the necessary summary before its dashboard history rolls out of view.
Which QR code analytics platforms offer the longest data retention?
Retention limits differ, so compare the published analytics history rather than assuming every platform keeps reports for the same period. QRMapper’s Enterprise plan provides 365 days of analytics history. For an organization reviewing campaigns across a longer planning cycle, that window may reduce the need for frequent exports. Compare the retained history with your reporting schedule and the kinds of records your team actually uses.
How long should businesses retain QR code campaign analytics?
For most QR code marketing campaigns, 30 to 90 days covers the active campaign phase. A business should also consider when its campaign review happens and whether it needs a summary for later comparisons. For example, a retail team reviewing seasonal promotions may preserve a final aggregate report beyond its working scan records. Keep campaign labels with saved reports so later reviewers can interpret results in context.